

HDPE Geomembrane Factory Quality Checks That Prevent Liner Failures
2026-11-16
Liner failures rarely announce themselves. They start as a hairline crack, a weak weld, an untested resin batch—and by the time you notice, the damage is done. That is why factory quality checks matter more than most engineers admit. At WEN FENG STONE, each HDPE geomembrane goes through a series of checks designed to catch those hidden defects before they leave the factory floor. In this post, we break down the exact inspections that prevent costly liner failures and why they should be non-negotiable in your next project.
Resin lot fingerprinting before the first extrusion
Before any resin enters the first extrusion step, capturing a lot-specific fingerprint is one of the few chances to see the material in its truly unmodified state. Once heat and shear are applied, the polymer's thermal history is permanently altered, making later analysis more about the process than the incoming raw material. A pre-extrusion fingerprint typically combines melt flow rate, moisture content, and differential scanning calorimetry traces that record the melting and crystallization behavior unique to that particular lot.
These baseline measurements do more than confirm a certificate of analysis. Subtle shifts in the melt flow curve or the onset of crystallization can reveal batch-to-batch variation that would otherwise show up as surging, die lines, or inconsistent part dimensions after extrusion. For example, a lower-than-expected oxidation induction time might flag a partially degraded lot before it ever reaches the feed throat. By archiving rheology curves and thermal signatures against the supplier's lot number, a converter builds a reference library that turns the first extrusion into a controlled handoff rather than a blind start.
Full-roll thickness mapping that ignores edge-only sampling
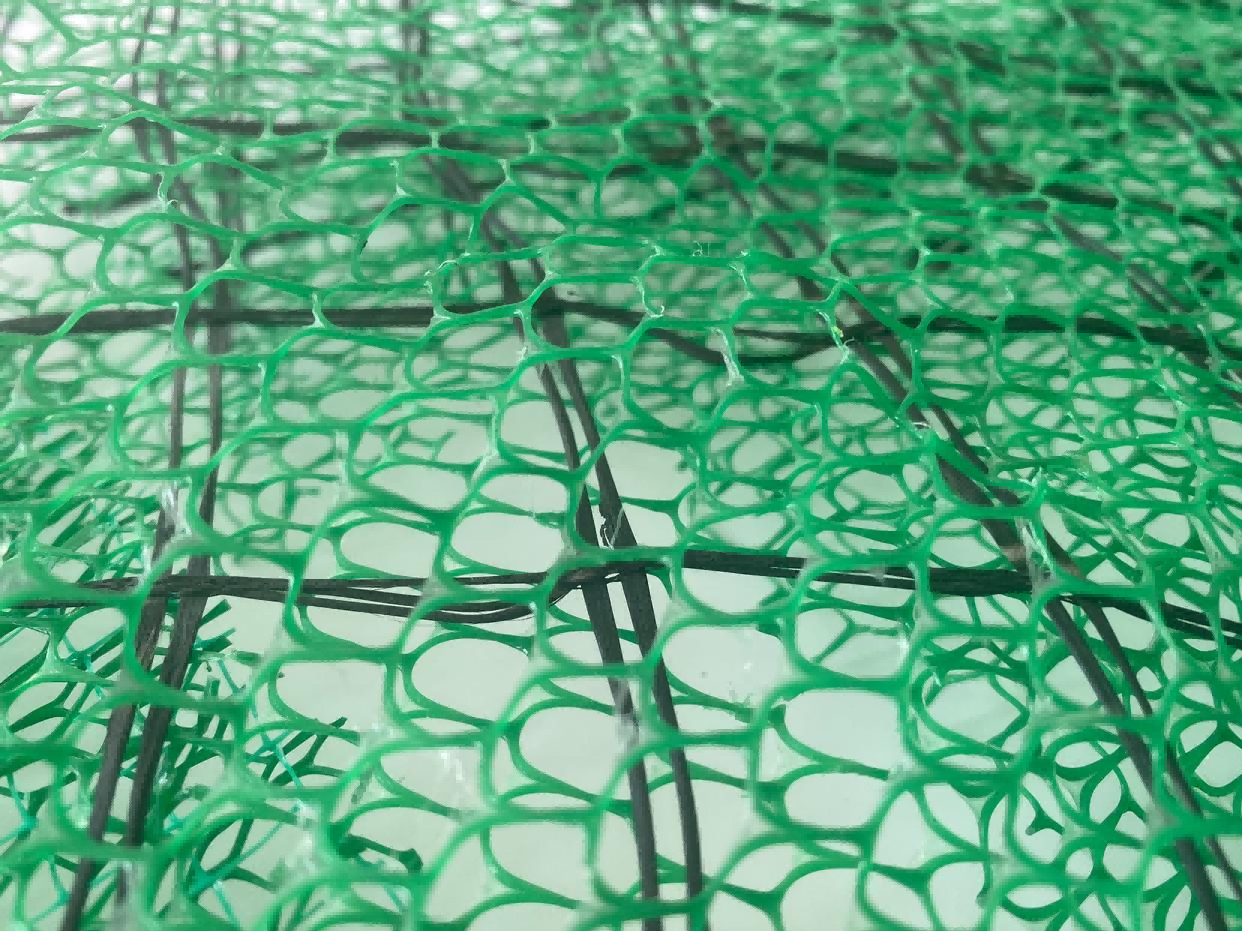
Measuring only the edges of a coated roll has always been a compromise. It cuts scan time, but it relies on the risky assumption that the center behaves like the edges. In practice, die lines, streaks, and cross-web thickness variation rarely respect that assumption. A full-roll thickness map removes the guesswork by measuring the entire surface, so problems in the middle of the roll show up just as clearly as problems at the edges.
The main argument for edge-only sampling is speed, yet the time saved often disappears when a hidden center defect reaches the customer. Full-roll mapping collects thickness data across the complete width and length of the roll in a single pass. The resulting profile shows not just average thickness, but also local deviations that edge samples would have missed. This makes it possible to trace a thin spot back to a specific coating die or dryer zone instead of guessing from a handful of edge points.
Ignoring edge-only sampling also changes how operators set up a line. Instead of adjusting based on two narrow bands at the roll edges, they can see the total transverse profile and make corrections that actually flatten the whole sheet. For products where uniformity matters—optical films, battery electrodes, adhesive layers—this level of detail is no longer optional. A full-roll map gives the data needed to hold tighter tolerances without slowing down production.
Weld peel tests pushed past the yield point
Most weld peel tests stop at the first sign of yielding, treating that moment as failure. Pushing the specimen further changes the picture entirely. The weld metal and surrounding heat-affected zone undergo strain hardening, and the peel angle steepens as the crack front stalls. This is where a joint's real fracture resistance shows up.
Beyond the yield point, the test measures not just load at initial deformation but the energy absorbed during continued tearing. A weld that yields early can still absorb substantial work before the crack advances. The distinction matters for structures subjected to overload or impact, where the load path does not end at the elastic limit.
Running peel tests past yield also exposes defects that conventional stop-at-yield procedures miss. Lack of fusion, porosity, or brittle intermetallic layers often stay hidden until the joint is forced into the plastic range. For qualification work, this means a simple change in test protocol can reveal whether a welding procedure truly delivers ductile failure or just a stiff but fragile bond.
Carbon black dispersion grading under a microscope
Assessing carbon black dispersion under a microscope is less about counting dots and more about reading the landscape of agglomerates. A trained eye moves from the largest undispersed clusters, which appear as irregular dark islands against a gray matrix, down to the finest background texture. The grading scale often reflects how much of the field is occupied by these islands versus the smooth, continuous phase, but seasoned technicians also note the shape and edge sharpness of agglomerates—soft, feathered boundaries suggest partial wetting, while hard, angular chunks indicate poor mixing energy.
Sample preparation can skew the reading more than the actual mixing process. Smearing a paste too thick hides small agglomerates beneath the surface, while pressing too hard shears weak clusters and artificially improves the grade. A practical approach is to compare the live microscope image against a set of physical or digital reference slides, but even then, subjective drift creeps in. Different operators may rate the same field a full grade apart because one focuses on the largest visible speck and the other on the number of mid-sized particles per square millimeter.
For production control, the microscope grade works best when tied to a specific downstream failure—like filter pressure rise, surface roughness in film, or tensile strength drop. Rather than chasing a universal “good dispersion” number, plants benefit from calibrating their own visual scale against a measurable defect threshold. That way, the under-microscope judgment becomes a fast, cheap proxy for performance, not an abstract score. And when disagreements arise, recalibrating with a shared set of images often settles the debate faster than arguing over the eyepiece.
Slow crack growth trials under simulated landfill loads
Evaluating slow crack growth under landfill conditions requires replicating the unique mechanical and chemical environment of a waste cell. Unlike standard laboratory tests that apply constant tensile loads in air or mild solutions, these trials embed pre-notched specimens in compacted synthetic waste media and subject them to sustained bending or tensile stresses. The goal is to mirror the long-term, low-intensity loading imposed by overburden pressure, uneven settlement, and localized stress concentrations from point loads such as sharp objects in the waste mass. Measurements focus on crack initiation time and propagation rate, often using compliance methods or periodic visual inspection through transparent loading platens. Because landfill leachate contains surfactants, organic acids, and inorganic salts, test solutions are frequently drawn from actual leachate or formulated to match its surface tension lowering and oxidative potential, which can accelerate slow crack growth in polyethylene and other geomembrane polymers.
A common approach involves three-point or four-point bending of notched bars while immersed in simulated leachate at elevated temperatures to compress the test duration. Temperature is a key accelerating factor, but care must be taken not to exceed the polymer's alpha transition, as this changes the failure mode from brittle slow crack growth to ductile yielding. Stress levels are typically kept below 50% of the short-term yield stress, simulating the safety factors used in landfill liner design. Some setups introduce cyclic loading to represent daily operational loads from waste compaction equipment or fluctuating leachate levels, although constant static load tests remain the benchmark for comparative evaluations. Data from these trials are plotted as crack length versus time, and the slope of the steady-state crack growth region provides a direct measure of resistance to slow crack propagation.
Field validation of these laboratory trials remains sparse, but correlations have been established between slow crack growth resistance and service lifetimes of geomembranes in actual landfill slopes and leachate collection systems. One noteworthy finding is that smooth geomembranes generally outperform textured ones under identical simulated loads, as the texture imparts stress concentrations at the base of asperities. Antioxidant package and carbon black dispersion also play outsized roles: inhomogeneous carbon black distribution creates microscopic defects that serve as slow crack initiation sites. Thus, the trials not only rank materials for regulatory compliance but also guide formulation adjustments for improved long-term durability in aggressive landfill environments.
Thermal aging runs that catch dimensional drift early
Plastics and composites rarely announce their surrender all at once. Instead, they creep a few thousandths of an inch, warp a fraction of a degree, and quietly abandon the tolerances that once made them reliable. The earliest sign of trouble is often the least dramatic: a housing that no longer seats flush, a seal that starts breathing where it used to hold, a mounting boss that leans just enough to change how a load travels through the part. By the time the shift becomes obvious to the naked eye, the aging process has already rewritten the material's internal rules.
Short-cycle thermal aging runs that catch dimensional drift early flip the usual failure analysis on its head. Instead of waiting for cracks or discoloration, the test fixture watches length, width, flatness, and hole position at every cool-down interval. A part that grows 0.2% in one axis while staying stable in another tells a very different story than a part that shrinks uniformly. That asymmetry points to fiber orientation, molded-in stress, or a processor's hand that never quite relaxed. Catching that drift in the first 50 cycles, rather than the 500th, gives design teams a chance to adjust gate location, add a rib, or switch to a grade with better dimensional memory before tooling budgets are already committed.
The real value shows up when the data stops being a pass/fail stamp. A well-instrumented thermal aging run maps drift as a vector over time, grade, and geometry. It shows whether the movement is elastic and recoverable, or plastic and permanent. It reveals if the part drifts most in the first ten cycles and then settles, or if the change accelerates late in the test. Teams that read these early maps can redesign around the actual movement pattern instead of chasing a generic “high heat” rating. In the end, catching dimensional drift early isn't about avoiding failure in the lab—it's about predicting how the part will behave after three summers under a hood, and engineering that behavior into the design from the start.
FAQ
The critical checks start with incoming resin verification—melt flow index, density, and carbon black content—before extrusion. Then the sheet undergoes thickness mapping across the full roll width, tensile yield and break strength, elongation, tear resistance, puncture resistance, and stress crack resistance (SP-NCTL). Each batch also gets oxidative induction time testing to confirm antioxidant package stability. Without these, a liner can pass visual inspection and still fail in service.
Thickness is measured continuously during production using laser or beta gauges, and then manually checked at multiple points per roll. The lowest individual reading must still meet the specified minimum, not just the average. Thin spots are a common failure pathway because they concentrate stress and are more easily punctured or torn during installation and operation.
Stress cracking is one of the most common long-term failure modes, especially in areas with high tensile stress or temperature cycles. The single point notched constant tensile load test (SP-NCTL) exposes the material to a surfactant at elevated temperature under a fixed load. A factory that monitors this catches brittle resin lots or processing issues that could cause premature cracking years after installation.
Carbon black provides UV protection and some mechanical reinforcement, but if it is poorly dispersed or forms agglomerates, those spots become stress concentrators and oxidation initiation points. Quality checks include microscopic dispersion rating and carbon black content by ASTM methods. Well-dispersed carbon black helps the liner resist UV degradation and maintain ductility over decades.
When panels are prefabricated or when roll edges are joined, factory seams undergo both destructive and non-destructive testing. Destructive tests include shear and peel tests on sample welds made at the same time. Non-destructive testing—typically vacuum box or air pressure—checks the full seam length for leaks or voids. Only seams that pass both types are accepted.
Oxidative induction time (OIT) measures how long the polymer's antioxidant package remains effective under accelerated aging conditions. A short OIT means the liner will start degrading sooner when exposed to heat and oxygen, even if it looks fine at delivery. Factories run both standard and high-pressure OIT tests to screen out batches with insufficient stabilization.
Dimensional stability, flatness, and surface appearance are checked because wavy edges, large gels, or uneven shrinkage can create installation problems and localized stress. A roll that is not flat may wrinkle during deployment, and wrinkles can become stress points or cause seam gaps. So appearance is not cosmetic—it is directly tied to long-term liner integrity.
Conclusion
HDPE geomembrane quality control begins long before installation, with resin lot fingerprinting performed prior to the first extrusion. This step verifies the chemical signature of each polymer batch, catching subtle shifts in molecular weight or additive packages that could compromise long-term stress crack resistance. Once sheet production starts, full-roll thickness mapping replaces conventional edge-only sampling, scanning the entire width to identify thin zones hidden near the core. These low spots, if undetected, become weak points under landfill loads, eventually leading to puncture or tear. Weld peel tests are then pushed past the yield point, ensuring that seam strength exceeds the parent material even under aggressive peeling, so joints never become the failure path.
On the microscopic side, carbon black dispersion is graded under a microscope because poorly distributed particles create UV-degradation hot spots and reduce oxidation resistance. Slow crack growth trials simulate years of landfill pressure and chemical exposure, revealing brittle failure tendencies that standard tensile tests miss. Finally, thermal aging runs track dimensional drift early, catching shrinkage or expansion before rolls leave the factory. Together, these checks form a layered defense: raw material identity, thickness uniformity, weld integrity, additive distribution, and long-term durability are all verified under realistic conditions, dramatically lowering the odds of a liner failure in service.
Contact Us
Contact Person: Jennifer LEE
Email: [email protected]
Tel/WhatsApp: 8618553418999
Website: https://vip.e-baixing.com/wenfengshitong