
High-Precision Transient Wave Recording Fault Indicator Company: Advancing Power Grid Monitoring
2026-09-24
What if your grid could tell you exactly what went wrong, down to the microsecond, before a fault even escalates? That's no longer hypothetical. Xiasen has engineered a high-precision transient wave recording fault indicator that turns fleeting electrical anomalies into actionable data. In this post, we’ll explore how their technology is advancing power grid monitoring from reactive to predictive—and why that matters for every utility operator.
Decoding Transient Events Before They Become Outages
In a power network, nearly every second carries small voltage dips, harmonic distortions, or switching surges. Most are harmless, but a handful carry the early signature of equipment fatigue or a loose connection. The problem is that these transient events don't announce themselves; they hide in routine noise.
Field engineers have long used event recorders, but the real value lies in distinguishing a capacitor bank switching from a breaker contact wearing down. That requires looking at waveform shape, duration, and repetition rather than just magnitude. A single spike might mean nothing, while the same spike occurring every afternoon under load tells a different story.
Once those patterns are recognized, operators can schedule targeted maintenance before a fault becomes a full-blown outage. It shifts the work from reactive repairs to quiet intervention—tightening a clamp, replacing a sensor, or adjusting settings before customers ever notice.
The Precision Behind Reliable Fault Detection
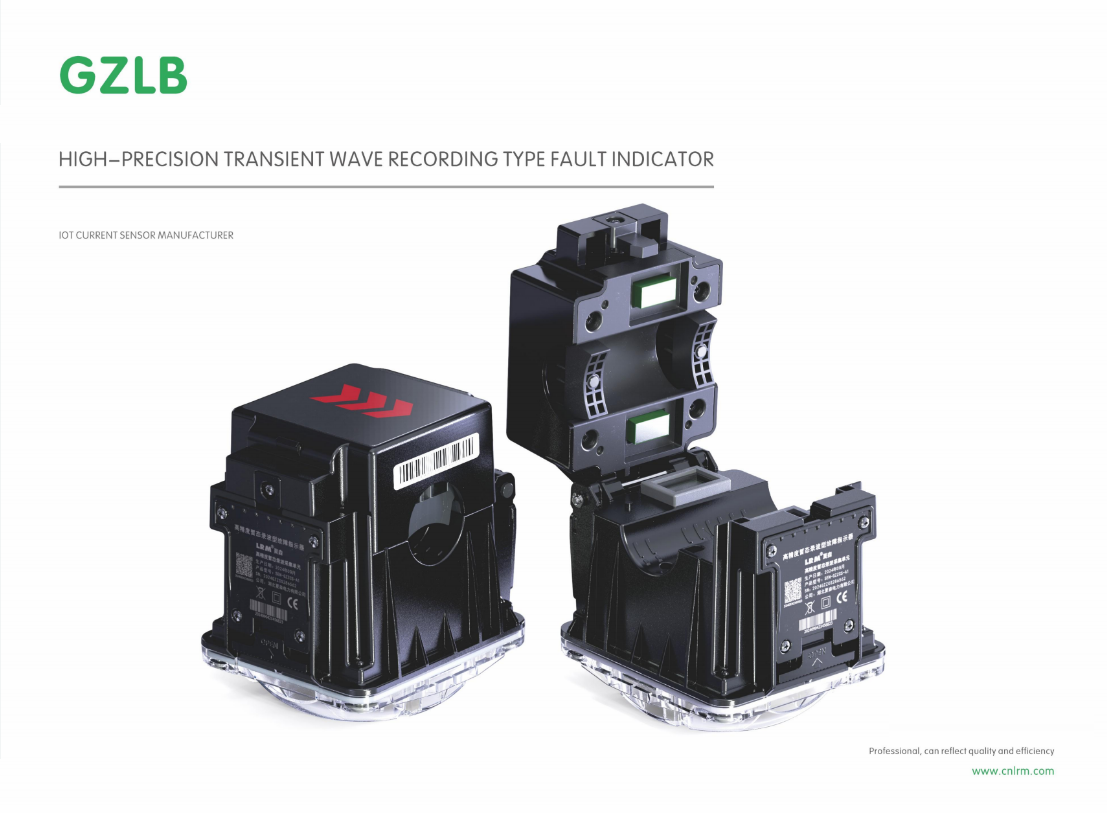
Fault detection hinges on the ability to distinguish a genuine anomaly from background noise. Even a few millivolts of drift can signal insulation breakdown, but only if the measurement chain preserves that subtle change. High-resolution analog front ends, low-noise grounding, and synchronized sampling work together to capture transient signatures that cheaper setups smear into obscurity. Precision here isn't just about bit depth; it's about timing consistency and repeatability across temperature swings and load shifts.
A reliable detector does more than trigger at the right moment. It suppresses false alarms by learning the baseline behavior of the system and adjusting thresholds dynamically. When a contact resistance begins to climb or a partial discharge pattern repeats with rising frequency, the algorithm cross-checks multiple parameters before declaring a fault. That cross-validation step is what separates a robust warning from a nuisance trip, giving maintenance teams confidence to act without chasing ghosts.
Grid Monitoring That Learns From Every Waveform
Most grid monitors still trip on fixed thresholds—voltage sags below 0.9 per unit, current spikes above a set multiple. This one works differently. It treats each cycle's waveform as a dense data stream, learning the normal signatures of transformers, feeders, and capacitor banks. Over time, the system builds a library of what healthy power looks like at every node, so a deviation of just a few degrees in phase angle or a new harmonic in the 5th order can trigger attention long before a relay would notice.
Every waveform that passes through adds to that model, not as a stored recording but as a statistical update. A motor start in one facility, a PV inverter's switching noise on a cloudy afternoon, even a tree branch brushing a line—they all leave patterns that the system gradually separates from genuine anomalies. That means false alarms drop while real precursors, like partial discharge in cable joints or tap changer wear in transformers, surface earlier.
The learning doesn't stop once the grid changes. As new solar farms, battery storage, or EV charging clusters come online, the monitoring adapts to their unique harmonic fingerprints without a technician re-tuning thresholds. This keeps the view accurate even as fault currents shift and load profiles become less predictable—something static protection schemes simply cannot match.
Field-Proven Indicators for High-Stakes Power Lines
On a 345 kV river crossing in the Pacific Northwest, the control room doesn't wait for a fault to appear. Load cells clamped to dead-end insulators track minute shifts in conductor tension every 30 seconds. A 9% rise above seasonal baseline, combined with a sudden drop in ambient temperature, has twice triggered targeted drone inspections that found glaze ice forming on the upwind phase before any galloping could begin.
Leakage current monitors on porcelain insulator strings offer another layer. Instead of relying on equivalent salt deposit density readings from a weather station kilometers away, the field units sample surface conductivity at the tower itself. When the third harmonic of the leakage current exceeds 4 mA for more than ten minutes, crews are dispatched to wash or replace insulators on that specific structure. This threshold came from two winter seasons of correlating monitor data with actual flashover events on a coastal 230 kV line.
Vibration sensors mounted on spacer dampers have proven useful for lines crossing open farmland. The key is not just counting cycles, but tracking the ratio of high-frequency to low-frequency bending amplitude. One utility found that when this ratio stays above 1.8 for six hours, fatigue cracks at suspension clamps become likely within two years. That early signal lets them install additional dampers during a scheduled outage rather than responding to a broken strand after it happens.
Turning Millisecond Signals Into Maintenance Decisions
A single vibration spike, a fleeting current fluctuation, or a sub-second temperature rise often carries more diagnostic value than an hour of steady-state data. These millisecond-scale events are easy to miss with conventional threshold alarms, yet they frequently precede bearing fatigue, insulation breakdown, or misalignment. By sampling at high speed and processing the waveform on edge devices, maintenance teams can catch these transient signatures before they develop into costly failures.
The real challenge lies in converting raw waveform snapshots into a prioritized work order. For example, early-stage pitting on a bearing race produces repetitive impact patterns that appear only as microsecond bursts. Running envelope analysis and time-synchronous averaging on the incoming signal strips away background noise and highlights the fault frequency. Once the system recognizes a pattern linked to a known failure mode, it can automatically assign a severity score and attach the relevant vibration signature to the maintenance ticket, so technicians arrive with a clear diagnosis instead of a vague alert.
Noise rejection and contextual awareness separate useful alerts from nuisance trips. A sudden load change on a conveyor may mimic a developing gear defect for a few milliseconds, but a dynamic baseline model compares the event against recent operating conditions and historical behavior. Only when the deviation persists or matches a library of known fault patterns does the system trigger a maintenance decision. This turns a stream of fleeting signals into a reliable, action-oriented workflow that reduces unplanned downtime without overwhelming the team with false alarms.
Built to Catch What Standard Sensors Overlook
Many detection systems focus on obvious thresholds: a sudden spike, a sharp drop, a clear breach. But real-world anomalies often hide in the quiet spaces between those events—slow drifts, subtle correlations, tiny phase shifts that don't trigger conventional alarms. This system was designed to sit in that blind spot. Instead of waiting for a signal to cross a line, it watches the shape of the data over time, catching patterns that look unremarkable in isolation but become telling once context is added. The result is a sensor layer that sees what routine monitoring tends to dismiss as noise.
The core difference lies in how it weighs evidence. Standard sensors are typically tuned for known failure modes, which means they're efficient at confirming what engineers already expect. But rare or emerging issues rarely announce themselves that way. Here, incoming streams are compared against a running model of normal behavior, not a fixed set of rules. When the model notices a persistent shift in relationships between variables—even if every individual value stays within nominal range—it flags the trend early. That gives operators room to investigate before a minor irregularity hardens into a full-scale problem.
This approach also reduces alert fatigue. Because the system learns what "ordinary" looks like for each specific environment, it doesn't cry wolf over harmless fluctuations. It only surfaces signals that stand out against the baseline, which means fewer false positives and more attention left for real anomalies. In practice, that translates into less time spent chasing ghosts and more time spent on equipment that's genuinely starting to misbehave. It's not about building a louder alarm; it's about building a smarter sense of what deserves to be heard.
FAQ
The company designs fault indicators that capture transient waveforms with high precision, helping utilities spot line disturbances that standard devices often miss.
Instead of simply flagging that a fault occurred, the device stores the actual high-frequency waveform signature, so engineers can analyze the event rather than guess from a blinking light.
Many faults begin as subtle, short-lived transients. High-precision sampling preserves those details, making it possible to identify insulation breakdowns or tree contact before they escalate into outages.
Overhead distribution feeders, underground cable sections, and remote substations see the biggest gains, since those areas often suffer intermittent faults that are hard to locate.
It captures transient current and voltage waveforms, timestamped and stored locally, so crews can retrieve a clear picture of magnitude, duration, and fault direction.
When a feeder trips, the recorded waveform lets operators distinguish a permanent fault from a momentary one and pinpoint the likely location before dispatching a crew.
Yes, the design is built for pole-mounted or pad-mounted use, with wide temperature tolerance and sealed enclosures that keep moisture and dust out.
It shifts monitoring from simple on/off fault flags to continuous transient insight, giving utilities a more detailed view of grid health without adding separate sensors.
Conclusion
The company has built its reputation on transient wave recording that catches grid anomalies long before they evolve into full-scale outages. By sampling at high resolution, these fault indicators preserve the exact waveform signature of a disturbance, revealing whether a tree branch momentarily touched a conductor, an insulator flashed over, or a breaker hesitated. This detail matters because standard sensors often smooth over the very spikes and ringing that point to an incipient fault. The result is a monitoring layer that does not simply raise an alarm; it reconstructs the pre-fault timeline from raw waveform evidence.
Field deployments on high-stakes transmission and distribution lines show how this precision translates into action. Each captured waveform feeds back into pattern libraries, so the system grows more adept at separating harmless transients from conditions that demand immediate crews. Maintenance teams receive not a vague fault flag but a profile—peak current, duration, harmonic content—that lets them prioritize repairs before repeated stress hardens into a permanent failure. It is a shift from reactive outage response to a grid that learns from every event, however brief.
Contact Us
Contact Person: Liu Mengyang
Email: [email protected]
Tel/WhatsApp: 8618727589233
Website: https://www.cnlrm.com/en/